Economic Indicators Report
A comprehensive analysis of key economic indicators and their potential impact on various financial sectors and investment strategies.
GDP Growth
The latest GDP figures show a 2.8% growth rate, slightly exceeding market expectations. This positive trend suggests a robust economic recovery, potentially benefiting sectors such as consumer discretionary and industrials.
GDP Growth Rate Trend
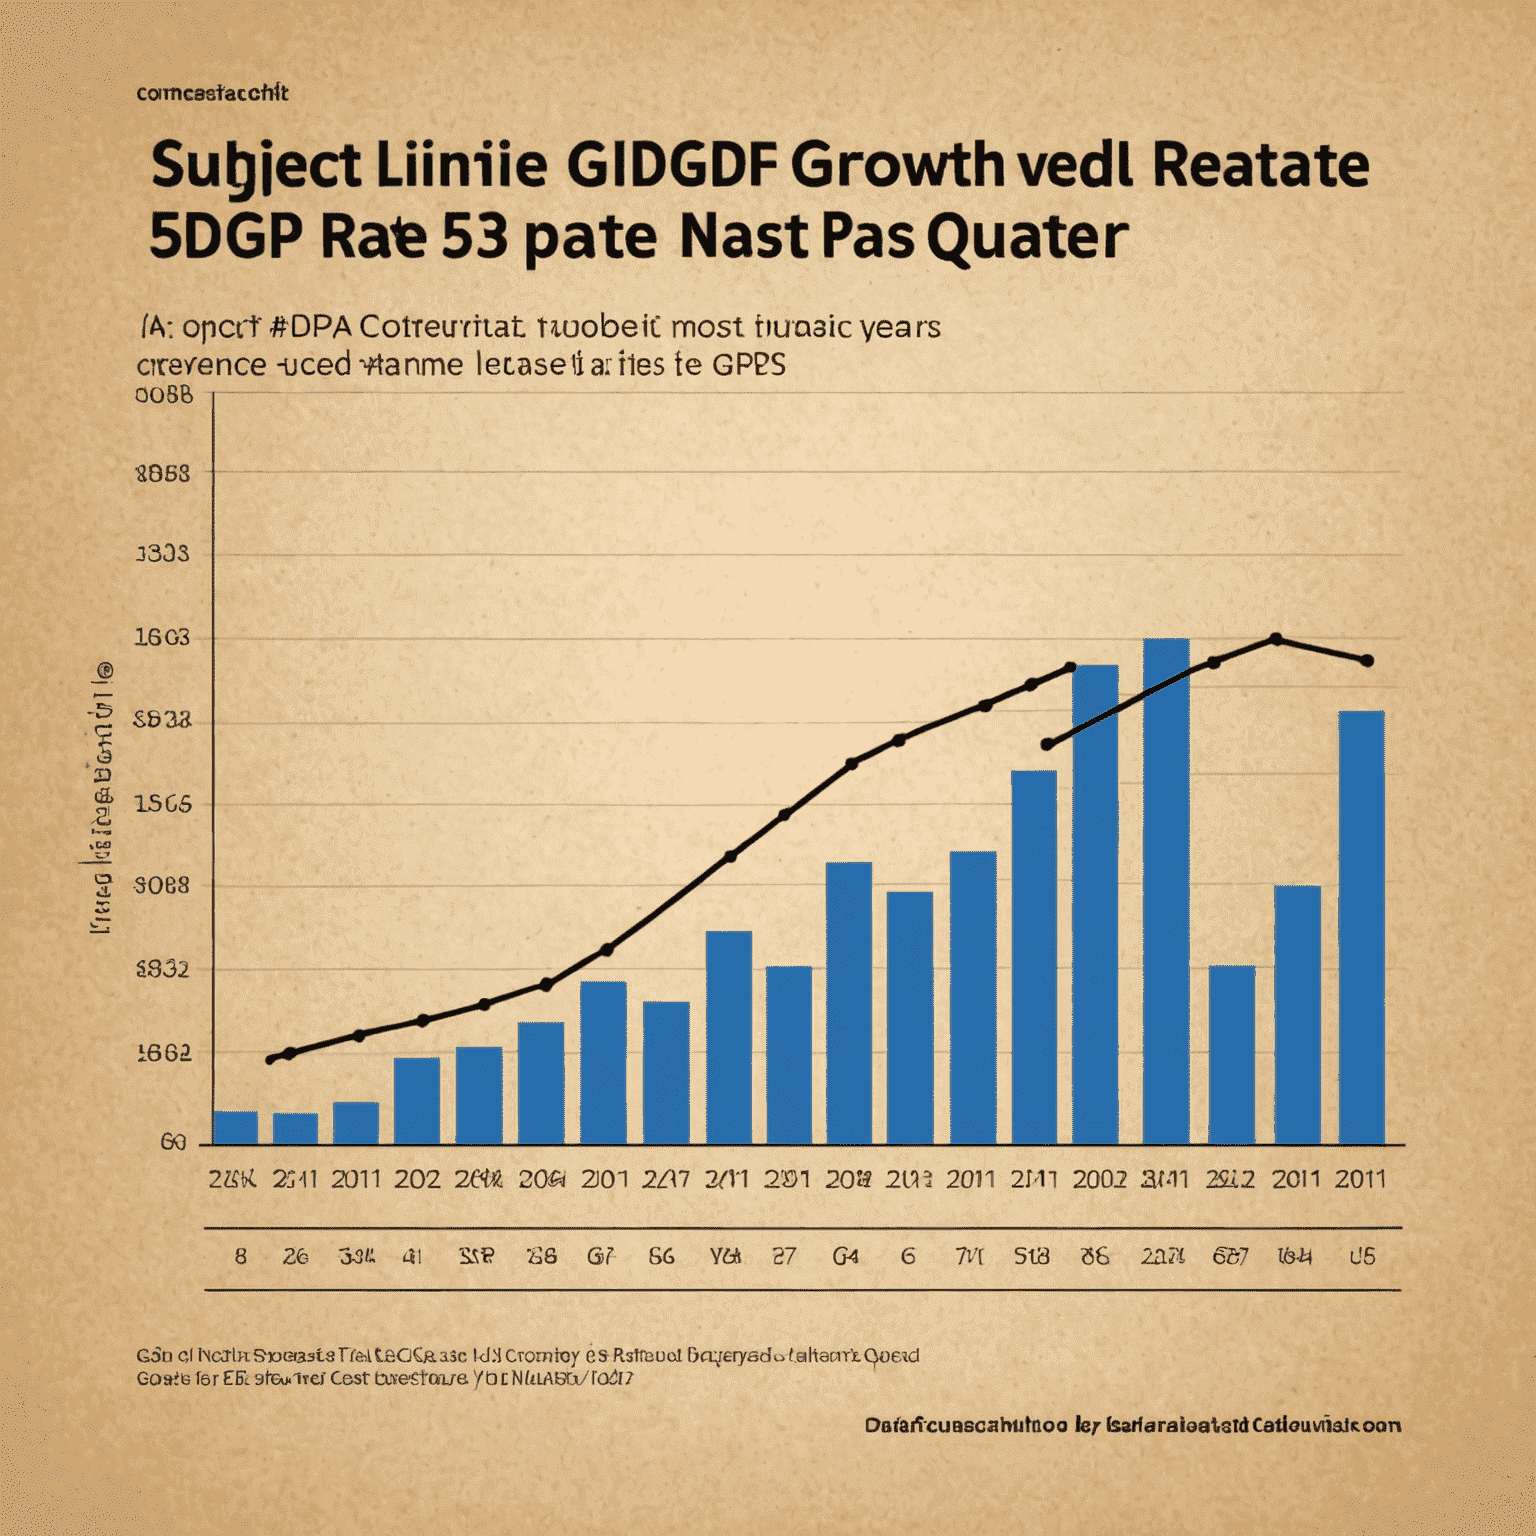
Source: National Bureau of Economic Statistics
Unemployment Rate
The unemployment rate has decreased to 4.2%, reaching pre-pandemic levels. This improvement in the labor market could lead to increased consumer spending and potentially higher inflation pressures.
Unemployment Rate vs. Position Openings
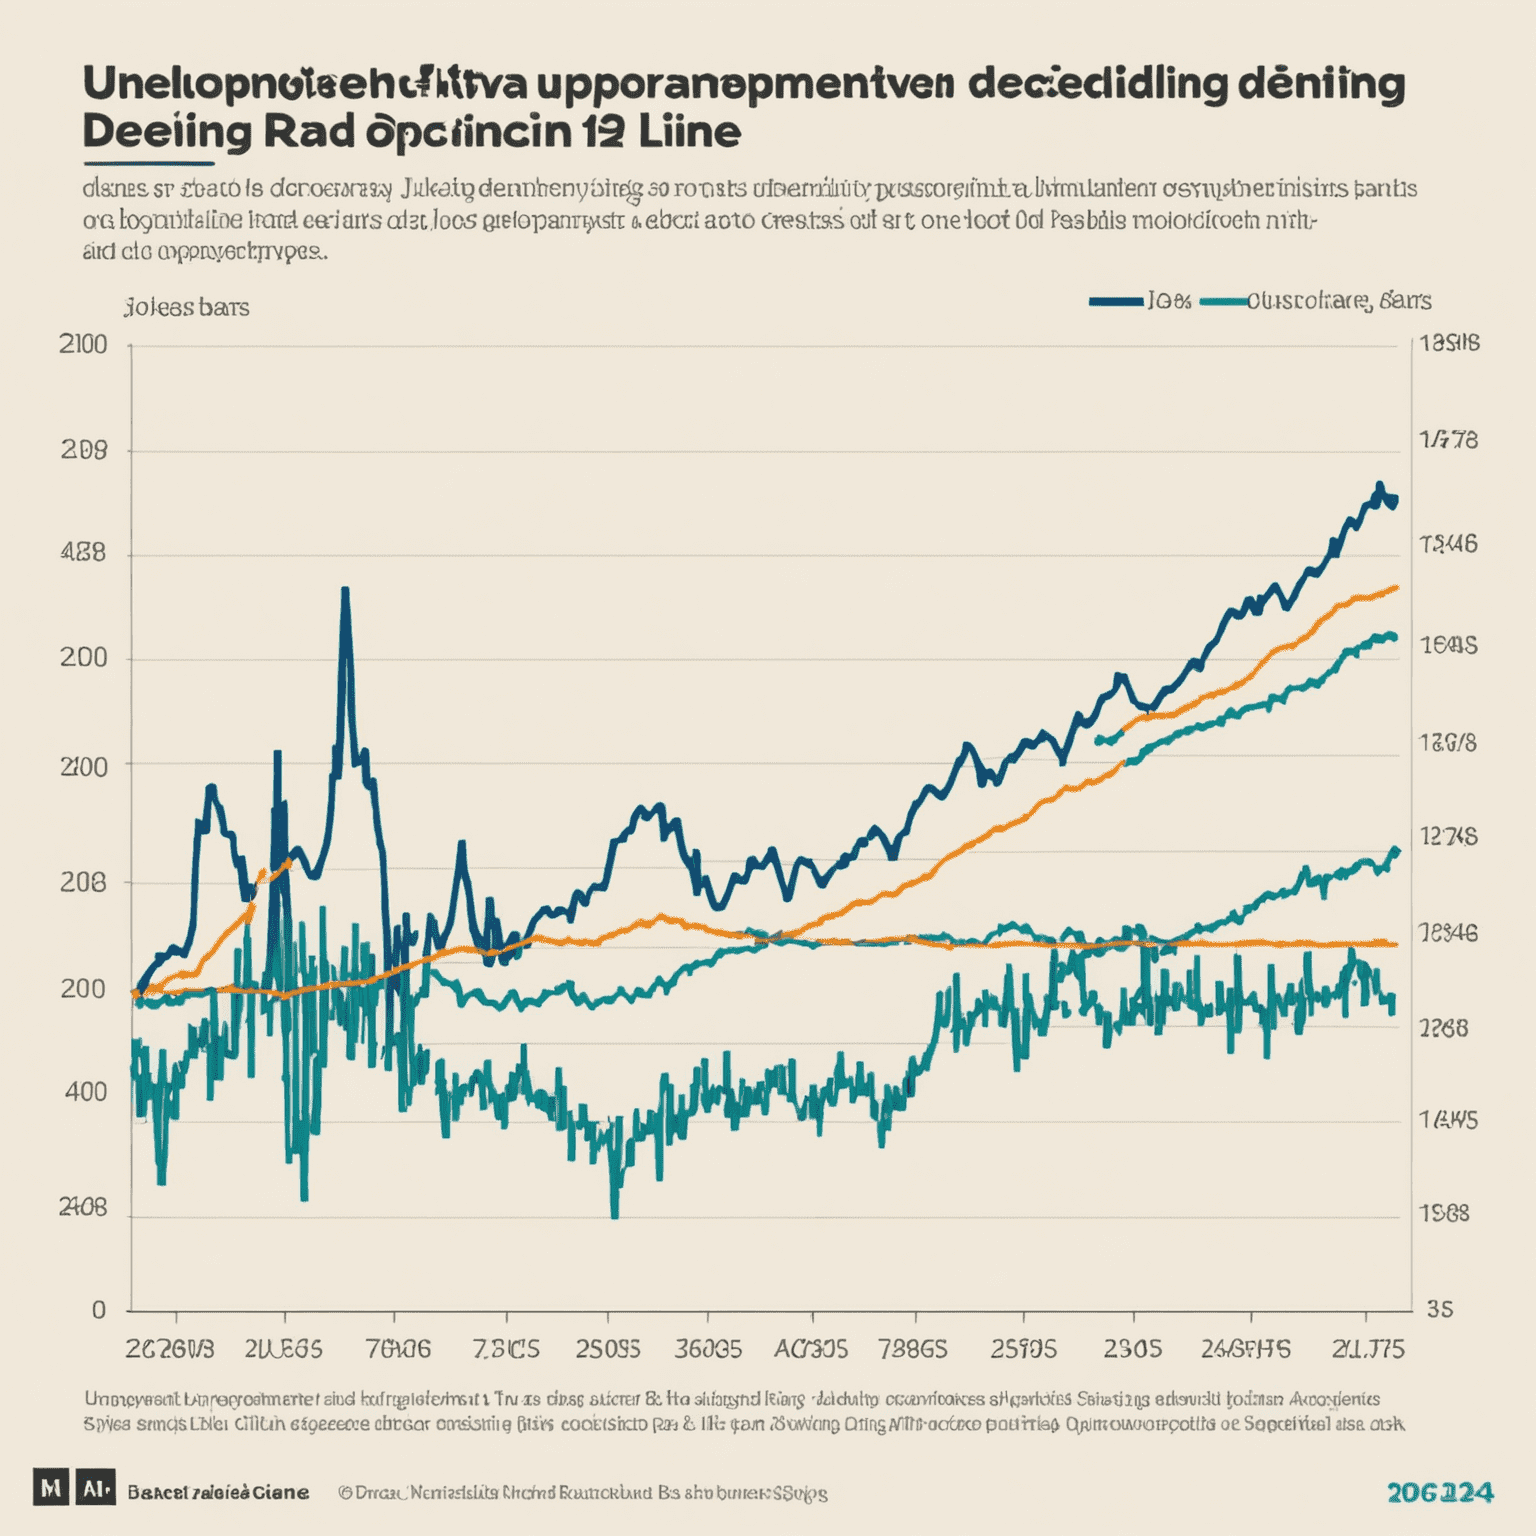
Source: Bureau of Labor Statistics
Inflation Rate
The annual inflation rate stands at 3.1%, slightly above the central bank's target. This persistent inflationary pressure may influence monetary policy decisions, potentially affecting interest-sensitive sectors like real estate and utilities.
Core Inflation Components
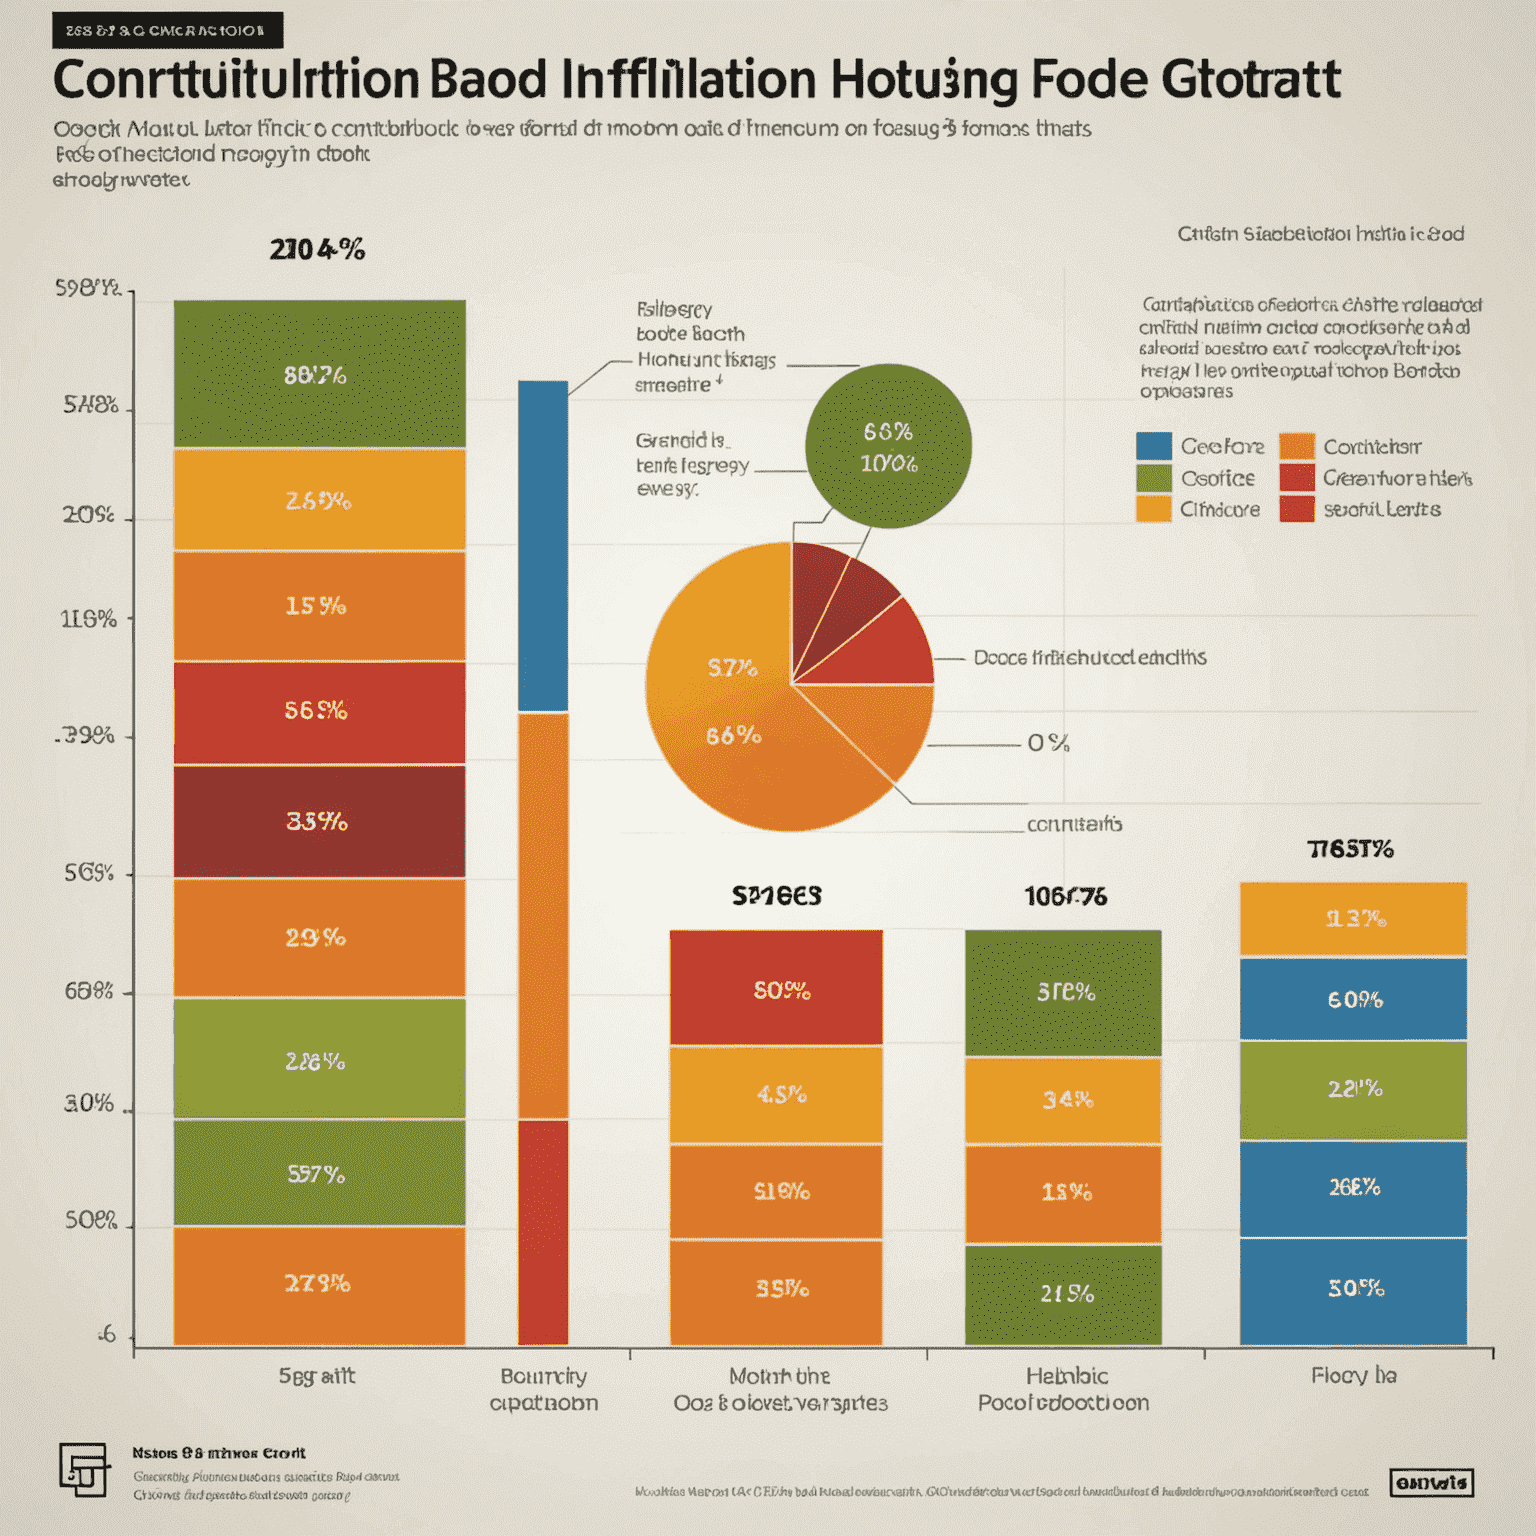
Source: Consumer Price Index Report
Interest Rates
The central bank has maintained its benchmark interest rate at 1.5%. However, given the strong economic growth and inflationary pressures, there's an increased likelihood of rate hikes in the coming quarters. This could impact borrowing costs and valuations across various asset classes.
Interest Rate Projections
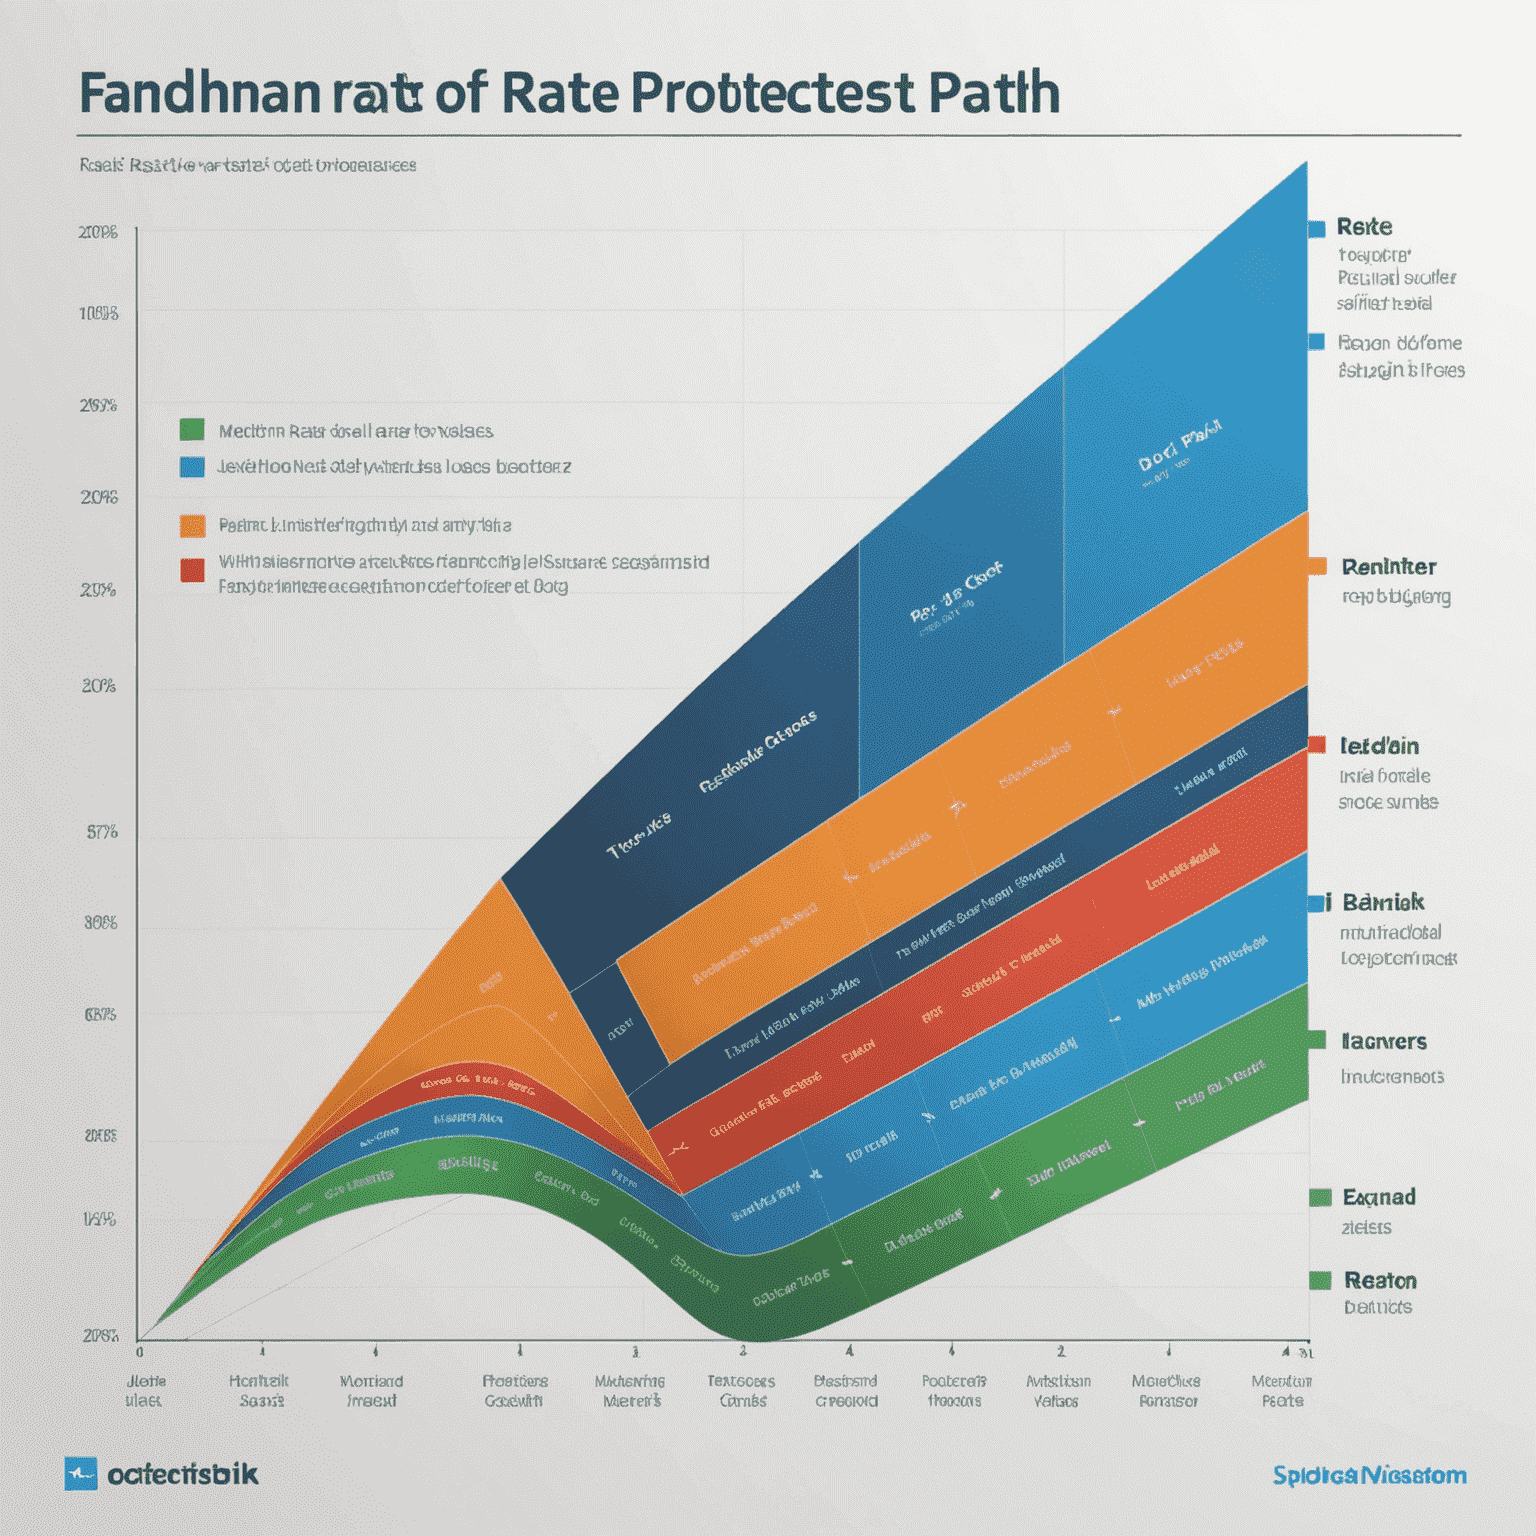
Source: Central Bank Economic Projections
Trade Balance
The trade deficit has narrowed by 15% compared to the previous quarter, primarily due to strong export growth in the technology and agricultural sectors. This improvement in the trade balance could support currency strength and benefit multinational corporations.
Trade Balance by Sector
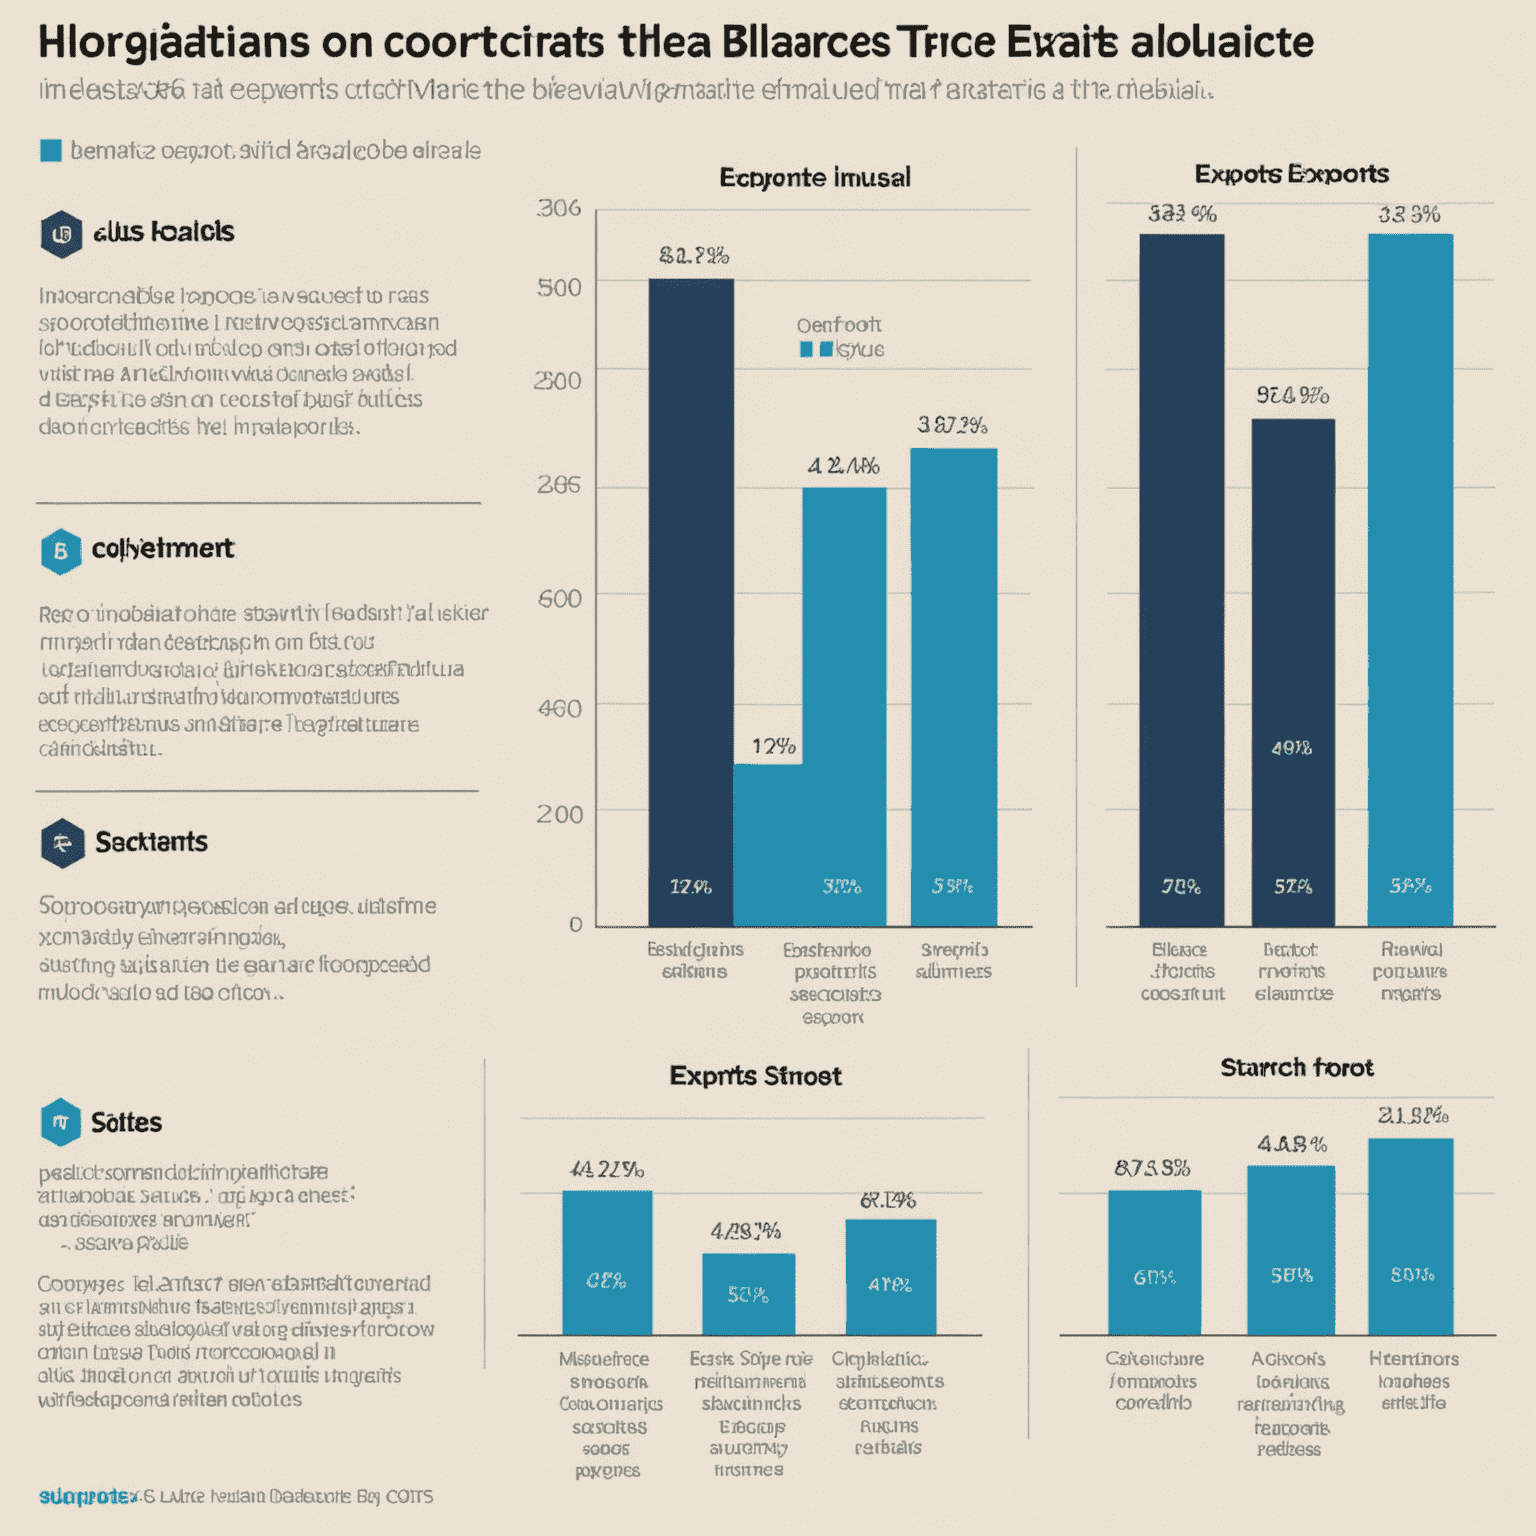
Source: International Trade Administration
Investment Implications
Given the current economic indicators, investors might consider the following strategies:
- Overweight cyclical sectors benefiting from economic growth, such as industrials and consumer discretionary.
- Monitor inflation-protected securities as a hedge against rising prices.
- Be cautious with long-duration fixed income assets due to potential interest rate increases.
- Explore opportunities in export-oriented companies benefiting from improved trade balances.
- Keep an eye on potential market volatility as monetary policy evolves.
Key Takeaway
The current economic indicators paint a picture of robust growth with some inflationary pressures. While this environment presents opportunities across various sectors, investors should remain vigilant and adapt their strategies to potential monetary policy shifts and market dynamics.